Microsoft Fabric vs. Power BI: What’s the Difference?
Microsoft Fabric vs. Power BI: Architecture, Capabilities, Data Governance, and Use Cases
Choosing the right data analysis tool can be tough with so many options available. Two popular choices are Microsoft’s Power BI and Microsoft Fabric.
Let’s dive into their functionality, design, security, industry focus, and more. We’ll also guide you on how to integrate these tools and address common queries.
In my opinion, comparing Microsoft Fabric and Power BI helps shed light on their unique strengths and use cases. Microsoft Fabric appears to be a comprehensive platform, offering a wide array of data integration, engineering, and analytical capabilities. Its lakehouse architecture, AI services, and real-time analysis features make it a promising choice for organizations dealing with large volumes of data and complex analytics requirements.
Table of Contents
Microsoft Fabric vs. Power BI: What’s the difference?
Architecture
Capabilities
Security and Governance
Use Cases
Integrating Microsoft Fabric with Power BI
Concluding Thoughts
Frequently Asked Questions (FAQs)
Related Reads
Microsoft Fabric vs. Power BI: Architecture
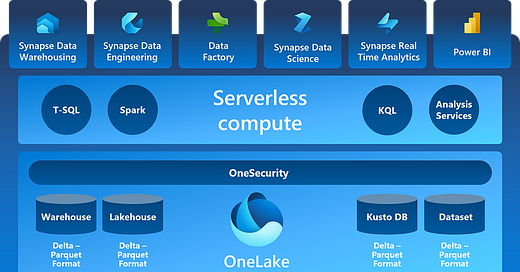
Microsoft Fabric Architecture Overview
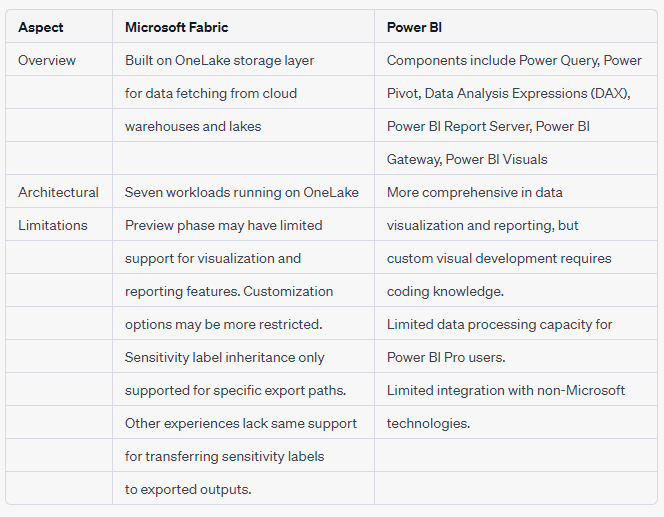
Microsoft Fabric is built on OneLake, utilizing a lakehouse architecture to fetch data from cloud warehouses and lakes, including Microsoft platforms and Amazon S3. This departure from traditional relational storage allows for data to be stored in the open-source delta lake format.
Overall, Microsoft Fabric comprises seven workloads that run on OneLake:
Data Factory: A data integration service.
Synapse Analytics services: Offering Data Warehousing, Data Engineering, Data Science, and Real-Time Analytics.
Power BI: The business intelligence service.
Data Activator: A real-time monitoring service.
Power BI Architecture Overview
Power BI is a data visualization tool that helps users build reports and dashboards. Its components include:
A data connection technology for data transformation.
Power Pivot: An in-memory data modeling component.
Data Analysis Expressions (DAX): The formula language used in Power BI.
Power BI Report Server: A server-based platform for publishing reports within an organization’s firewall.
Power BI Gateway: A bridge between Power BI’s cloud service and on-premises data sources.
Power BI Visuals: Graphical elements like charts and graphs for visualizing data.
Architectural Limitations
While Microsoft Fabric offers a versatile data solution, it is currently in the preview phase, which may result in limited support for certain data visualization and reporting features compared to the standalone Power BI platform. Additionally, customization options in Microsoft Fabric might be more restricted, potentially making it time-consuming to create unique components outside the standard library.
Power BI, on the other hand, may have challenges when figuring out which component is ideal for specific use cases, and troubleshooting issues within the tool can be time-consuming due to the absence of movable parts.
Microsoft Fabric vs. Power BI: Capabilities
Microsoft Fabric Capabilities
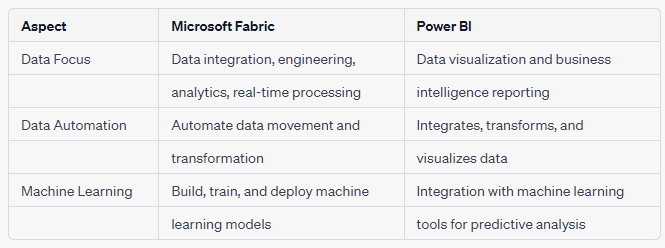
Microsoft Fabric allows users to automate data movement and transformation, store and analyze large volumes of data in a centralized lakehouse, build, train, and deploy machine learning models, process and analyze data in real-time, and visualize and analyze data through reports and dashboards. Additionally, Microsoft Fabric’s AI services can be leveraged in workflows, and upcoming conversational language support will make it easier for business users to interact with the system.
Power BI Capabilities
Power BI enables users to integrate, transform, and visualize data. Its Power BI Desktop offers a wide range of visualization options for creating interactive reports, which can then be published to the cloud-based Power BI Service for collaboration and sharing. Power BI also supports building interactive dashboards that provide consolidated views of key metrics and visualizations, allowing users to explore and analyze data through filtering and slicing.
General Capability Limitations
Microsoft Fabric’s limitations include information protection capabilities, where support for manual labeling, default labeling, mandatory labeling, and inheritance may vary for different items within the platform. Additionally, Microsoft Fabric (Preview) trial capacity does not support autoscale.
On the other hand, Power BI has limitations in custom visual development, as creating custom visuals requires coding knowledge (JavaScript). It also has restrictions on data processing capacity, with Power BI Pro handling up to 10GB of data per user.
Microsoft Fabric vs. Power BI: Security and Governance
Microsoft Fabric Security and Governance
Microsoft Fabric ensures data security through features such as Conditional Access, which allows controlling access based on user identity and location, Regional Resiliency for data reliability, and Lockbox, giving explicit approval control over Microsoft engineers’ access to data. For governance and compliance, Microsoft Fabric offers Information Protection with sensitivity labels, enabling data discovery, classification, and protection.
Power BI Security and Governance
Power BI uses Role-Based Access Control (RBAC) and Row-Level Security (RLS) to provide more granular data access control. It also offers data classification, auditing, monitoring capabilities, dataset certification, data lineage, and impact analysis for data governance. Other features include scheduled data refresh, collaboration, and sharing functionalities.
Microsoft Fabric vs. Power BI: Use Cases
Microsoft Fabric Use Cases
Microsoft Fabric is suitable for managing large volumes of structured data, simplifying data integration, supporting end-to-end data science workflows, enabling real-time analysis, and facilitating accurate predictions for future trends.
Power BI Use Cases
Power BI supports a range of use cases for data analysis and visualization. It allows users to communicate insights and monitor evolving trends with a variety of visualization options and real-time analytics. Power BI also integrates with machine learning tools for predictive analysis.
Both Microsoft Fabric and Power BI have their strengths and can be used together to create a comprehensive data solution. Microsoft Fabric’s capabilities cover the backend management and preparation of data, while Power BI specializes in analyzing and visualizing data for reporting.
Integrating Microsoft Fabric with Power BI: Here’s what you need to know
To integrate Power BI with Microsoft Fabric, follow these steps:
Sign up for a free trial of Microsoft Fabric and create a new workspace with assigned Fabric capacity.
Create a Lakehouse in your workspace and name it (e.g., “SalesLakehouse”).
Prepare and load data into the Lakehouse using Dataflows Gen2.
Add a data destination for each table in the Lakehouse, specifying the update method (e.g., “Replace” or “Append”).
Orchestrate a data pipeline within the Lakehouse editor, adding pipeline activities as needed.
Create a semantic model by accessing the SQL Endpoint of the SalesLakehouse and establishing relationships between tables.
Remember, while both Microsoft Fabric and Power BI have their individual strengths, using them together can provide a more comprehensive data solution for your organization.
Microsoft Fabric vs. Power BI: Concluding Thoughts
In conclusion, Microsoft Fabric and Power BI are both valuable data analysis tools with distinct strengths and use cases. Microsoft Fabric offers a comprehensive platform for data and analytics, including data integration, engineering, and real-time analytics. On the other hand, Power BI is a specialized business intelligence tool for data visualization and reporting.
While these tools can be used independently, they are designed to work together to provide a more robust and complete data solution. By leveraging the strengths of both Microsoft Fabric and Power BI, organizations can optimize their data analysis processes and make data-driven decisions effectively.
Microsoft Fabric vs. Power BI: Frequently Asked Questions (FAQs)
What are the key differences between Microsoft Fabric and Power BI?
Microsoft Fabric is an integrated solution that combines various Microsoft applications for data integration, engineering, analytics, and business intelligence. In contrast, Power BI is a dedicated business intelligence tool focused on data visualization and generating actionable insights.
In which scenarios should I use Microsoft Fabric instead of Power BI?
If your data analysis needs extend beyond business intelligence and require services like data movement, data engineering, real-time analytics, and data science, then Microsoft Fabric is the more comprehensive solution. However, if your primary requirement is data visualization and business intelligence, Power BI will suffice.
Can Power BI be used in conjunction with Microsoft Fabric?
Yes, Power BI is already integrated into the Microsoft Fabric platform, allowing users to leverage its data visualization and reporting capabilities within the larger Microsoft Fabric ecosystem.
My Thoughts
As a data visualization and data engineer with a decade of experience, I find the comparison between Microsoft Fabric and Power BI quite insightful. Microsoft Fabric emerges as a comprehensive solution for storing, managing, and analyzing data, thanks to its multiple workloads and lakehouse architecture built on OneLake. It excels in data integration, real-time analysis, and machine learning model building, making it an attractive option for data practitioners seeking a versatile platform.
Power BI, on the other hand, focuses primarily on data visualization and reporting, with additional capabilities for data integration and transformation. As part of the Microsoft Fabric platform, it complements the broader data solution but also functions independently.
One limitation that caught my attention is that Microsoft Fabric is still in its preview phase, which may result in certain data visualization and reporting features being limited compared to the fully developed Power BI platform. Additionally, the lack of customizable options in Microsoft Fabric might be a drawback for those seeking to create unique components outside the standard library.
Integrating both tools seems like a compelling approach, as it allows organizations to leverage the strengths of each platform. By combining Microsoft Fabric’s data management capabilities with Power BI’s visualization prowess, businesses can create a more comprehensive data solution that covers the entire data pipeline, from data ingestion to insightful reporting.
Ultimately, the choice between Microsoft Fabric and Power BI will depend on an organization’s specific needs. For data-focused tasks like data engineering and real-time analytics, Microsoft Fabric seems like a robust option. For teams looking for a dedicated business intelligence and data visualization tool, Power BI would be a compelling choice.
The security features of both tools are commendable, with Microsoft Fabric offering conditional access, regional resiliency, and lockbox, while Power BI leverages RBAC, RLS, and data classification for secure data access and governance.
Understanding the ideal use cases for each tool is crucial, with Microsoft Fabric being suitable for data ingestion, processing, and real-time analysis, while Power BI excels in data visualization, interactive reporting, and real-time analytics.
Leveraging Microsoft Fabric for data ingestion and processing, combined with Power BI for visualization and reporting, can create a robust and comprehensive data analytics environment. The choice between the two tools ultimately depends on the specific needs and requirements of the organization, and integrating them can lead to a powerful data-driven ecosystem.
Related Reads
Microsoft Fabric 101: A Comprehensive Overview of Microsoft’s New Data Platform
Microsoft Fabric vs. Snowflake: Features, Architecture, and Use Cases
8 Ways AI-Powered Data Catalogs Save Time Spent on Documentation, Tagging, Querying & More
What is Active Metadata? — Definition, Characteristics, Example & Use Cases
Open Source Data Catalog Software: 5 Popular Tools to Consider in 2023
Data Catalog Platform: The Key To Future-Proofing Your Data Stack
Top Data Catalog Use Cases Intrinsic to Data-Led Enterprises
Business Data Catalog: Users, Differentiating Features, Evolution & More Related Reads
Microsoft Fabric 101: A Comprehensive Overview of Microsoft’s New Data Platform
Microsoft Fabric vs. Snowflake: Features, Architecture, and Use Cases
8 Ways AI-Powered Data Catalogs Save Time Spent on Documentation, Tagging, Querying & More
What is Active Metadata? — Definition, Characteristics, Example & Use Cases
Open Source Data Catalog Software: 5 Popular Tools to Consider in 2023
Data Catalog Platform: The Key To Future-Proofing Your Data Stack
Top Data Catalog Use Cases Intrinsic to Data-Led Enterprises
Business Data Catalog: Users, Differentiating Features, Evolution & More
I hope this article has been helpful to you. Thank you for taking the time to read it.
If you enjoyed this article, you can help me share this knowledge with others by:👏claps, 💬comment, and be sure to 👤+ follow.
💰 Free E-Book 💰
Who am I?👨🏾🔬 Gabe A is a Python and data visualization expert with over a decade of experience. His passion for teaching and simplifying complex concepts has helped numerous learners grasp the intricacies of data analysis. Gabe A believes in the power of open-source technologies and continues to contribute to the Python community through his blogs, tutorials, and code snippets.
💰 Free E-Book 💰


